TikTok Engagement
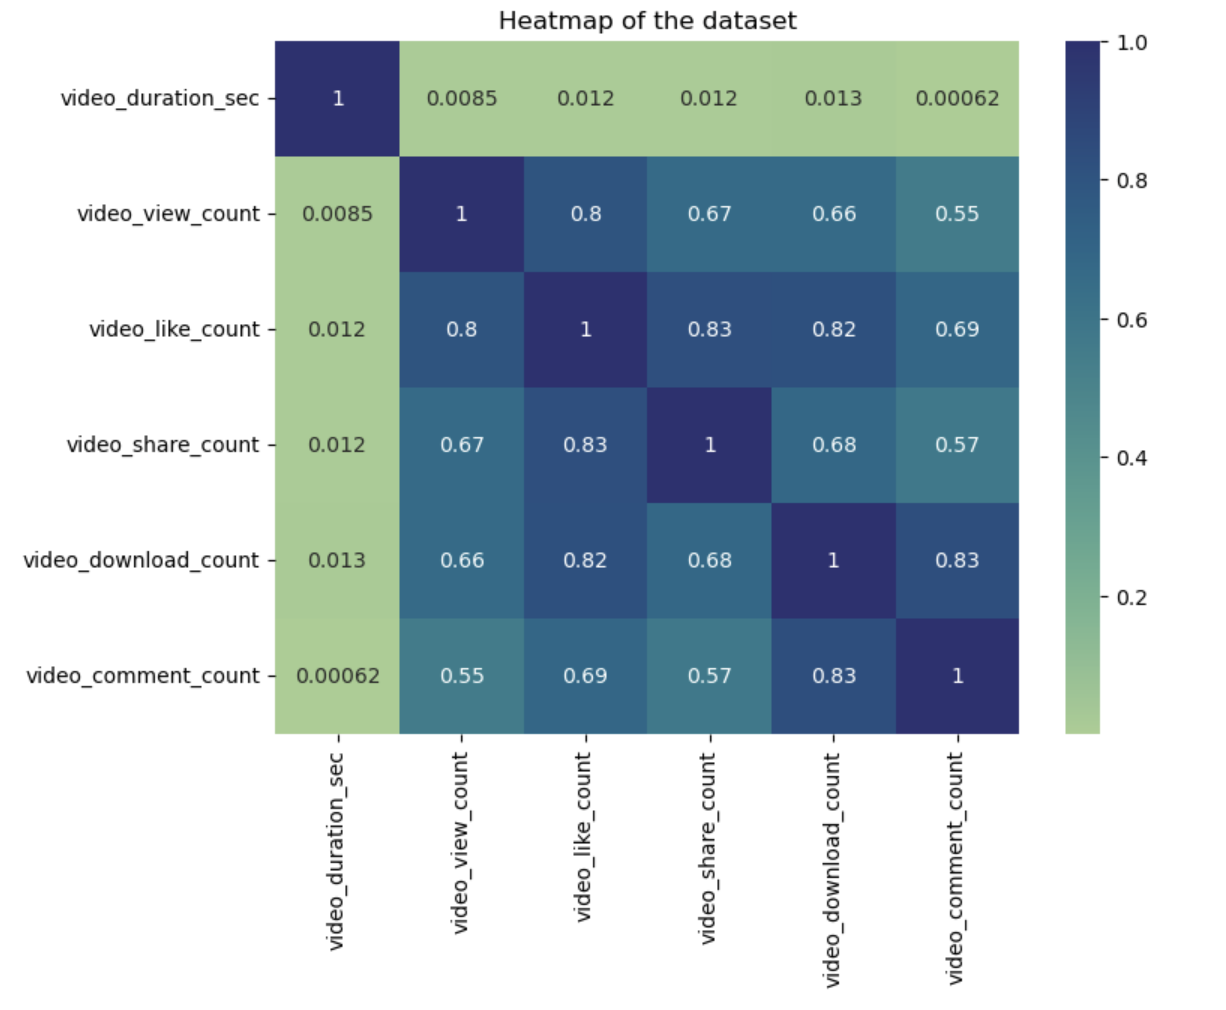
This project explores TikTok engagement using data from Kaggle, motivated by the TikTok ban signed by President Biden. Our EDA involves examining the dataset structure, and focuses on certain variables within the dataset. Feature selection and transformation were crucial steps, particularly for logistic regression, where multicollinearity among the features was addressed by excluding certain variables, like video_like_count. Principal Component Analysis (PCA) was attempted for dimensionality reduction, even though the dataset's low dimensionality made it less effective. For clustering, I applied the k-means algorithm, with the number of clusters determined by identifying an elbow point in the plot of within-cluster sum of squares. In this case, three clusters were chosen, and the data was visualized to show the distribution of videos based on engagement metrics. Finally, I suggested areas for further research, including optimizing models with hyperparameters and experimenting with different feature selections for the k-means analysis. Below are some of the visualizations included in the project. Explore the detailed findings and analysis through Colab.
This project enhanced my skills in several key areas of data science. I gained experience in exploratory data analysis (EDA), feature selection, and transformation using Python. Addressing multicollinearity and applying logistic regression deepened my understanding of model preparation and evaluation. Using Principal Component Analysis (PCA) and k-means clustering taught me dimensionality reduction and clustering techniques. Additionally, visualizing engagement metrics and recommending further research refined my abilities in data visualization and model optimization.